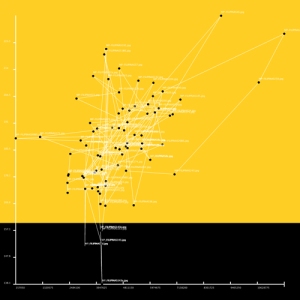
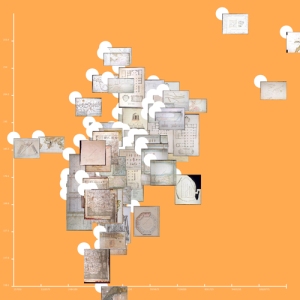
After some playing with ImageJ and working through tutorials through the Cultural Analytics Project, I have started to come out with some initial composites. These images map a set of 200 images from the archive according to mean greyscale values (x-axis) compared to area of image (y-axis).


